Best Practices to follow in Angular Development– Part II


In our last blog, i.e. Best Practices to follow in Angular Development in 2020– Part I, we had outlined numerous Angular app development practices that could be highly beneficial to the Angular developers. These included the following:
- Rules for Angular Coding Styles
- Top Security Practices to be followed in Angular
- Routing and related Practices to be considered in Angular
- How to prevent memory Leaks
- How to use Template Directive
- Utilization of noteworthy accessibility tool- Angular CLI
So, this blog is the continuation of Part I and here, you will get a glimpse of a few more important tips and tricks that ease out the development process in Angular as well as result in an impeccable end-product. Do read the
Part I blog here.
Part I blog here.
Ideal Tips and Tricks for Angular App Development Process
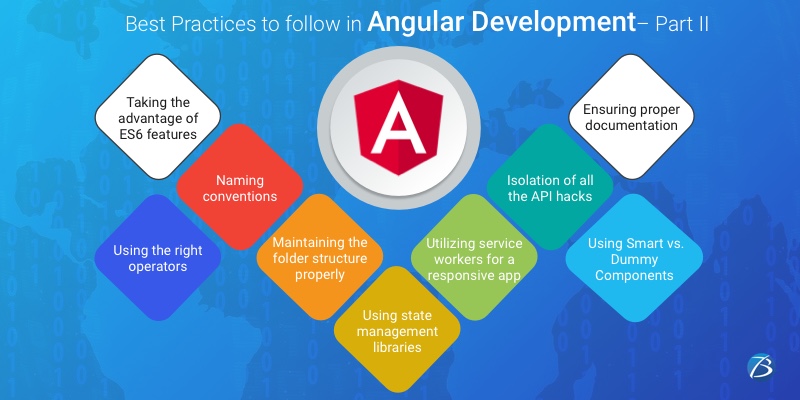
Taking the advantage of ES6 features
In Angular, one of the JS versions-ECMAScript, gets updated with interesting features and functionalities in every release of Angular. ES6 is its latest version and has vital features available for efficient development.
- ‘let and const’ instead of ‘var’: By making use of ‘let and const‘ rather than ‘var‘ helps you prevent the issues related to var. Developers can use ‘let‘in a normal situation and the value doesn’t get changed, then ‘const’ should be in its place.
- Spread operator: ES6 also comes with a ‘spread operator’ (depicted by three dots (…)) and is commonly used for arrays; but can also help in some common tasks. It helps ‘iterable‘ that can be, sets, strings, arrays, etc. to spread in the receiver.
Naming conventions
Naming conventions improves the readability and maintainability to a great extent. It helps the Angular app developers to find the required code, filenames, folders, etc. faster and makes the understanding easier. So, follow the below-mentioned naming conventions, as indicated by the Angular style guide:
- Use consistent names for all the available symbols.
- In the descriptive names, make use of dashes for separating words
- Follow a certain pattern that explains the features of the symbol first and then its type. The recommended pattern- feature.type.ts.
- Make use of dots for separating the descriptive name from the type.
- Also, make use of conventional type names like.component, .service, .module, .directive, .pipe, etc.
Maintaining the folder structure properly
It is of utmost importance to maintain a proper folder structure during Angular app development that can easily adapt to any modifications done during the development process. For instance:
— app
|– modules
|– home
|– [+] components
|– [+] pages
|– home-routing.module.ts
|– home.module.ts
|– core
|– [+] authentication
|– [+] footer
|– [+] guards
|– [+] http
|– [+] interceptors
|– [+] mocks
|– [+] services
|– [+] header
|– core.module.ts
|– ensureModuleLoadedOnceGuard.t
|– logger.service.ts
|
|– shared
|– [+] components
|– [+] directives
|– [+] pipes
|– [+] models
|
|– [+] configs
|– assets
|– scss
|– [+] partials
|– _base.scss
|– styles.scss
Using state management libraries
In Angular,
state management is useful for the management of state transitions as it helps store the state of any kind of data. Several state management libraries like NGXS, NGRX, Akita, etc. are available and they come with different usages, purposes, states, etc. Amongst all of these, NGXS is one of the most widely preferred libraries since it has an easier learning curve and is highly stable as compared to others.
state management is useful for the management of state transitions as it helps store the state of any kind of data. Several state management libraries like NGXS, NGRX, Akita, etc. are available and they come with different usages, purposes, states, etc. Amongst all of these, NGXS is one of the most widely preferred libraries since it has an easier learning curve and is highly stable as compared to others.
Using the right operators
Using appropriate operators in Angular is essential for various situations, especially when the flattening operators are used with the observables. So, follow the below ways for this:
- Try to use mergeMap for handling all the emissions concurrently if you are willing to handle one emission after the other goes for concatMap.
- Try to use switchMap when you want to ignore the previous emissions because of the new ones.
- For canceling the new emissions, try using an operator called exhaustMap.
Utilizing service workers for a responsive app
Service workers are especially helpful in making the apps interactive and responsive. They help in converting the SPAs into PWAs by integrating native features into them. They help in providing a native experience to the apps. They help in caching the version completely when the web pages are refreshed. Service workers also load the new or latest cached code in other tabs. They also download resources when the content is changed. Service workers can be used with any version of Angular above the fifth version.
Isolation of all the API hacks
For fixing the bugs and issues in the APIs, it is essential to have the hacks in components and also to isolate the API hacks in one place. This will help in keeping the hacks close to the API and thus, minimum code will have to deal with the un-hacked code. It also helps the Angular developers to find these hacks easily while fixing the bugs.
Using Smart vs. Dummy Components
Separating the smart and dummy components is another important practice that every
Angular app development company should follow. Dummy components are utilized only for presentation purposes, so they do not know where the data comes from. In such scenarios, using smart components that can inherit the presentation logic of dummy components is the best approach.
Angular app development company should follow. Dummy components are utilized only for presentation purposes, so they do not know where the data comes from. In such scenarios, using smart components that can inherit the presentation logic of dummy components is the best approach.
Ensuring proper documentation as much as possible
Last but not the least, it is a great practice to document the code, methods used, variables, etc. wherever possible. This helps other Angular developers to understand the logic and purpose of the code; which in turn improves code readability and management. Also, documenting the role and the applications of every variable and method is a good practice. For methods, every single parameter needs to be defined with multi-line comments specifying in brief about the tasks that the method accomplishes.
Key Takeaways:
Every release of Angular comes with some exciting features that the developer community and the Angular app development companies must be aware of. These will help in proactively avoiding blunders during development and keeping the applications bug-free.
Do have a look at our blogs for more knowledge on Angular:
That is all for today!
I hope this blog will be useful to every software company providing Angular app development services during the development of their Angular projects. In case you have some more tips and tricks to share with us, do comment below.
We would like to hear about it!