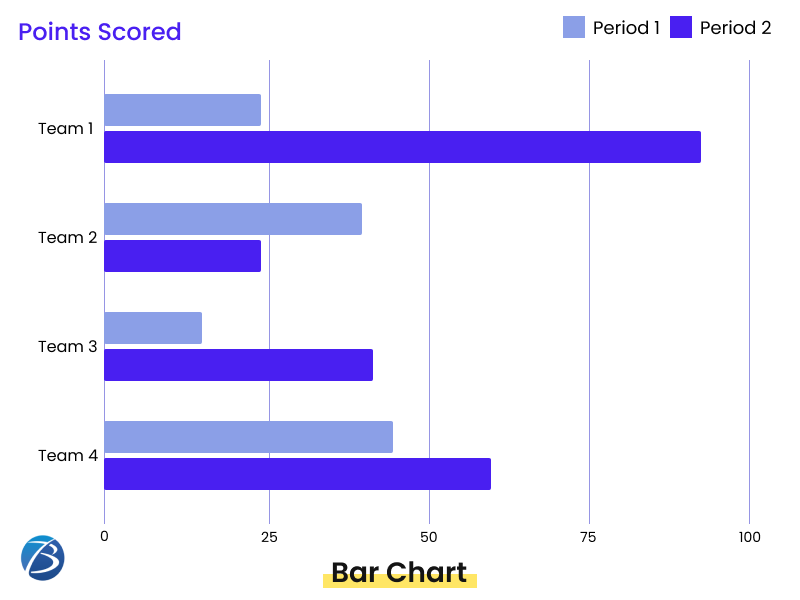
Charts are a visual representation of data. You can use charts to display information quickly and easily. Charts integrate text with graphics or symbols to indicate the relationship between several data sets. Take a look at these examples. You can use a bar chart for indicating the sales pattern of a product over a certain timeline say a few years. The length of a bar in the chart signifies the product sales for a specific year.
Charts are a great way to convey complex information and compare several data sets. This is because pictorial representation is often a more powerful tool to display information. Research has proven the fact that it’s easier to understand and remember data represented visually via charts over plain textual data. This way, viewers can grasp the insights faster and more effortlessly. Google Charts is also an effective tool for data analysis and identifying trends, patterns, and outliers. This is the most popular form of chart leveraged by modern-day entrepreneurs. Businesses are using these charts as a productive way of data visualization on their websites or web/mobile apps. The Google chart gallery comes with a huge variety of ready-made charts starting from simple line-based charts to complicated ones like hierarchical tree maps.
What do you need to know about Google charts?
Google-based charts are web-based solutions that help software development teams visualize their website data in the form of histograms, pictographs, etc. These charts are Cloud-based and allow software development teams to create various types of interactive graphs and charts for displaying crucial data on their websites.
Google’s visualization API powers the charts, So, web app development teams can effortlessly integrate these carts into web apps. Anyone having a Google account can access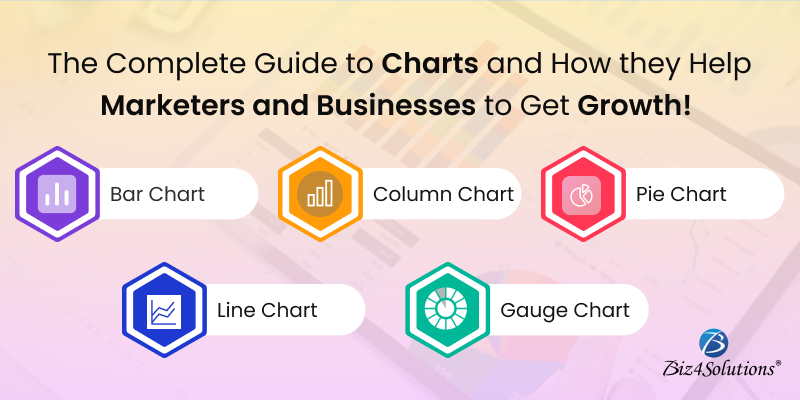
The charts are exposed as JavaScript classes and rendered with the help of SVG/HTML5 technology. This provides cross-platform portability to Android & iOS devices and cross-browser compatibility including VML for old IE versions. Entrepreneurs can even feed data into charts and create chart-related objects with the help of a selected ID. Users can refer to the Google Charts Documentation to seek assistance and resolve other queries.
Why is it important to use Google charts?
- It is free to use and comes with a user-friendly interface.
- It is an easy way to make a data visualization for your blog post or website.
- You can use it to display data in a variety of formats, from bar graphs to pie charts.
- Data visualization is the process of converting information into a graphical format that can be quickly comprehended and shared with others.
Features of Google-based charts?
- Content Management
- Custom Dashboards
- Compatibility with different browsers and mobile platforms.
- Multitouch Support
- Lightweight
- Simple Configurations
- Visual Discovery
- Multiple axes
- Configurable tooltips
- Date Time support.
- Dataset Management
- Print using a web page
- External data from a server
What are some benefits of using Google-created charts?
- Easily create charts with built-in templates.
- A large library of chart types to choose from.
- Flexible chart options to change colors, fonts, etc.
- Simple tools to animate data in a chart or make changes to it over time.
However, in order to reap the benefits of this JavaScript-based data visualization library to the fullest and achieve your goal, it’s important to select the right kind of chart. There are a wide variety of Google-provided charts. Each type of chart serves a specific purpose. You need to identify your objective and then select the chart type that best fits your requirement.
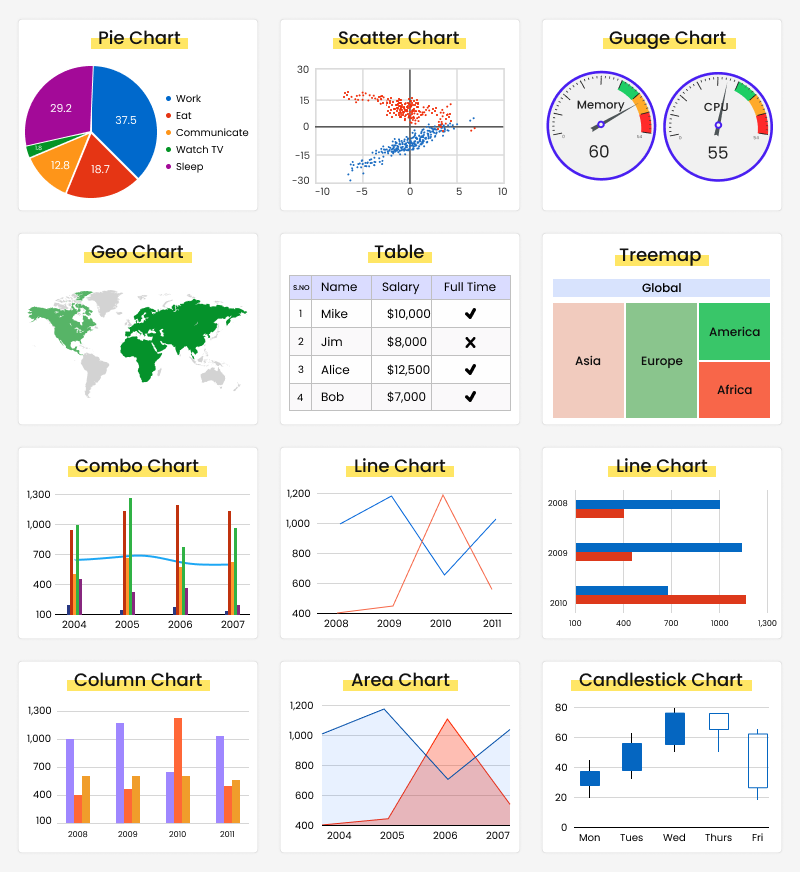
TYPES OF GOOGLE CHART
How Easy They Are!
Google’s Charts are important because they allow data visualization in the browser with no need to download and install a plug-in.
The Google Chart API is a JavaScript library that lets users create graphs, charts, and maps in the browser without having to download or install a plug-in. With this API, developers can create interactive visualizations for websites and applications.
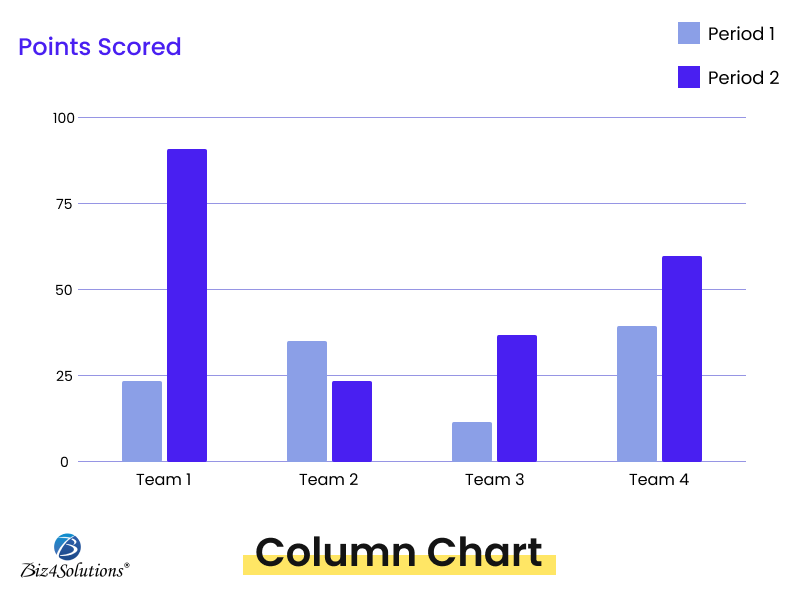
Some of the Visual EXAMPLES of the charts generated through google’s charts:
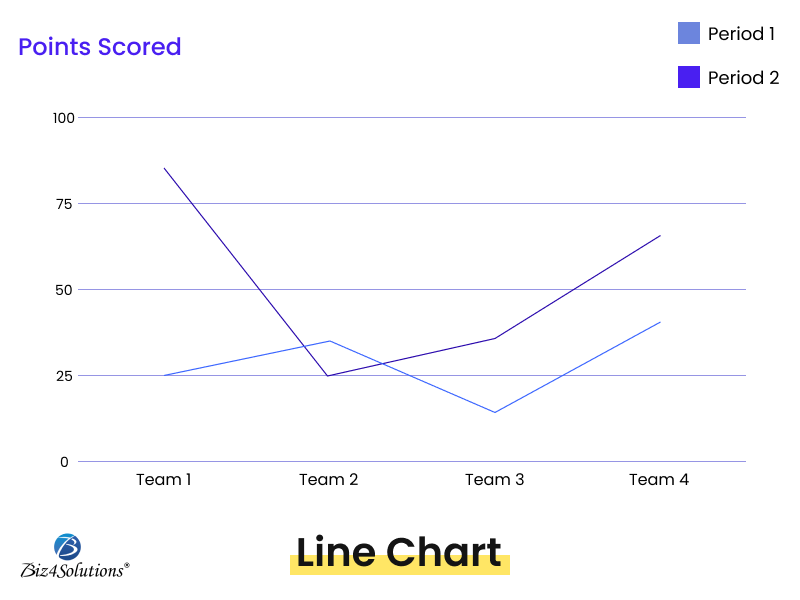
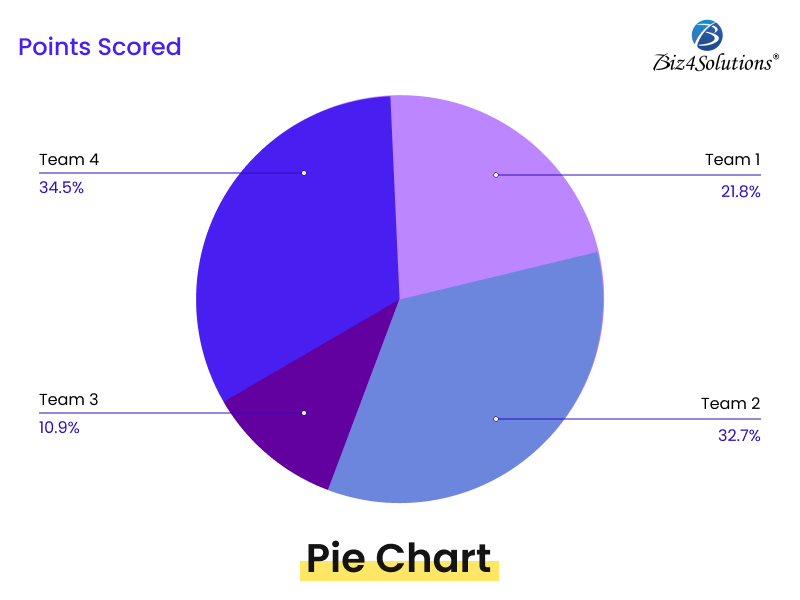
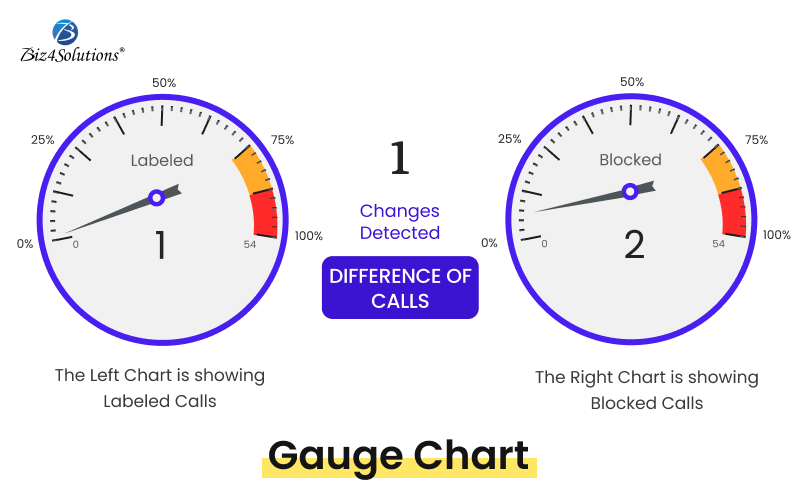
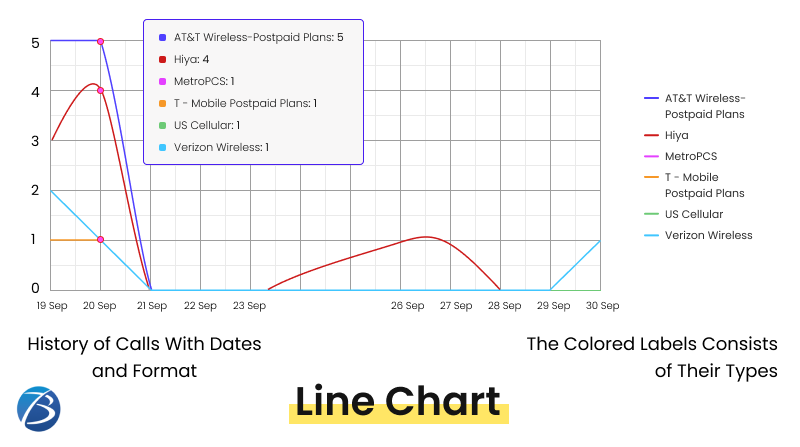
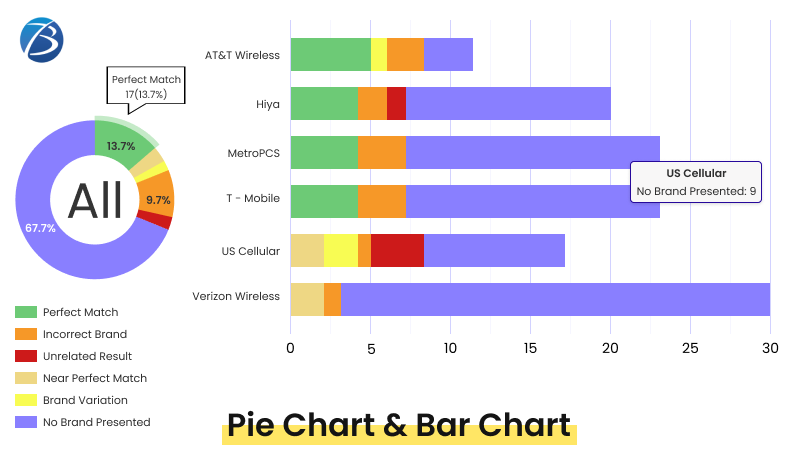
In the below Charts, we have merged the dataset to showcase the different formats. The Colored Labels Consists of Their Types:
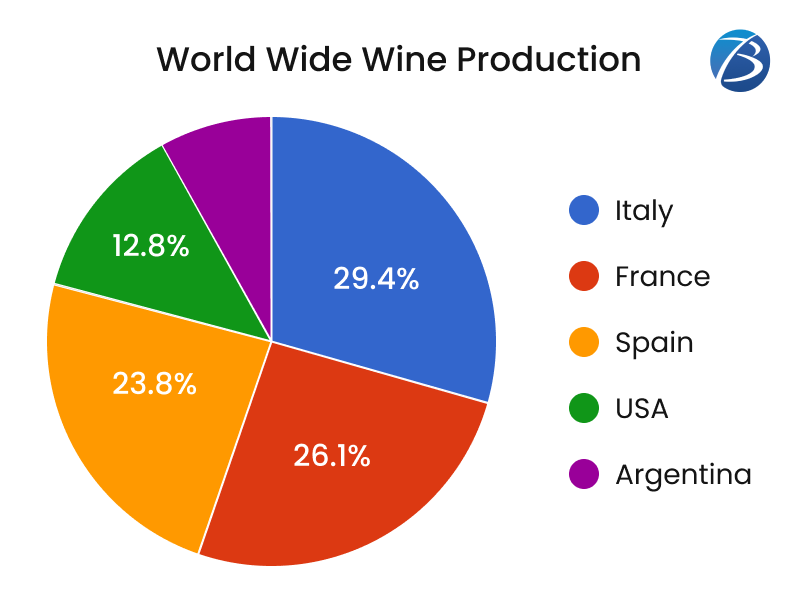
How to integrate Google chart Pie
<!DOCTYPE html>
<html>
<script type=”text/javascript” src=”https://www.gstatic.com/charts/loader.js”></script>
<body>
<div>
id=”myChart” style=”width:100%; max-width:600px; height:500px;”>
</div>
<script>
google.charts.load(‘current’, {‘packages’:[‘corechart’]});
google.charts.setOnLoadCallback(drawChart);
function drawChart() {
var data = google.visualization.arrayToDataTable([
[‘Contry’, ‘Mhl’],
[‘Italy’,54.8],
[‘France’,48.6],
[‘Spain’,44.4],
[‘USA’,23.9],
[‘Argentina’,14.5]
]);
var options = {
title:’World Wide Wine Production’
};
var chart = new google.visualization.PieChart(document.getElementById(‘myChart’));
chart.draw(data, options);
}
</script>
</body>
</html>
Challenges Faced While Integration
1. Displaying real-time data without reloading the page.
Solution: – By using jQuery.
2. User interface customization in accordance with the client’s requirements.
Solution: – By using bootstrap and with the help of jQuery.
3. Customizing the filters and labels that appear on the charts.
Solution: – With the help of HTML, CSS, and jQuery.
4. Retrieve the necessary data from the backend to present the results.
Solution: – Write an API in Laravel (PHP) to get the data and prepare by using jQuery to Display the google chart.
Are You Interested in Building a Top-Class Website or Mobile App?
In Conclusion
Data visualization with Google-provided Charts can work wonders in your web development process. And, the good news is that the charts are continuously being updated with new features and enhancements to stay relevant as per the changing trends and offer advanced functionalities to users.
However, you must take care that your chart is captivating enough to make your point more convincing and add credibility to the presentation. Also, follow the best practices while you implement these charts. You may consider hiring professional Google chart developers if your requirements are complex and you lack the necessary expertise.